Maximize Efficiency with the Best Enterprise Risk Management Dashboard
In a world where businesses face an ever-expanding universe of threats, your organization’s approach to risk management isn’t just a compliance checkbox—it’s a competitive advantage.
Enterprise Risk Management (ERM) dashboards have evolved from glorified spreadsheets into sophisticated command centers that separate market leaders from the also-rans.
The most effective organizations don’t just survive disruption; they anticipate it, quantify it, and transform potential catastrophes into strategic opportunities.
This comprehensive guide will revolutionize how you visualize, prioritize, and capitalize on risk in your organization, providing a clearer understanding of risk exposure and enabling improved decision-making.
What is Enterprise Risk Management?
Enterprise Risk Management isn’t just another corporate buzzword to add to your collection. It’s a strategic discipline that fundamentally changes how organizations identify, assess, and address uncertainties across multiple departments. Unlike traditional siloed approaches where each department builds its own risk fiefdom, ERM creates a holistic, portfolio view of significant risks affecting your entire enterprise.
Definition and importance of enterprise risk management
ERM is a structured, consistent, and continuous process for identifying, assessing, responding to, and reporting on opportunities and threats affecting the achievement of organizational objectives. It represents a shift from the reactive “wait until something breaks” model to a proactive approach where risks are anticipated and managed strategically.
Optimizing risk management strategies is crucial in ERM as it helps organizations assess and compare resources, understand the risk-reward tradeoff, and enhance efficiency while maintaining a strong risk posture.
The objective is simple yet powerful: develop a top-down, enterprise view of all significant risks that might impact strategic objectives. Think of it as the difference between looking at individual trees (traditional risk management) versus surveying the entire forest (ERM). Tools like the bowtie platform provide an organization-wide overview of all risks and related information, ensuring a comprehensive understanding of the risk landscape.
As described by NC State’s ERM Initiative, “An effective ERM process should be an important strategic tool for leaders of the business. Insights about risks emerging from the ERM process should be an important input to the organization’s strategic plan.”
This integrated approach allows organizations to:
- Make risk-informed strategic decisions
- Reduce operational surprises and losses
- Identify and manage cross-enterprise risks
- Provide integrated responses to multiple risks
- Seize opportunities when competitors cannot
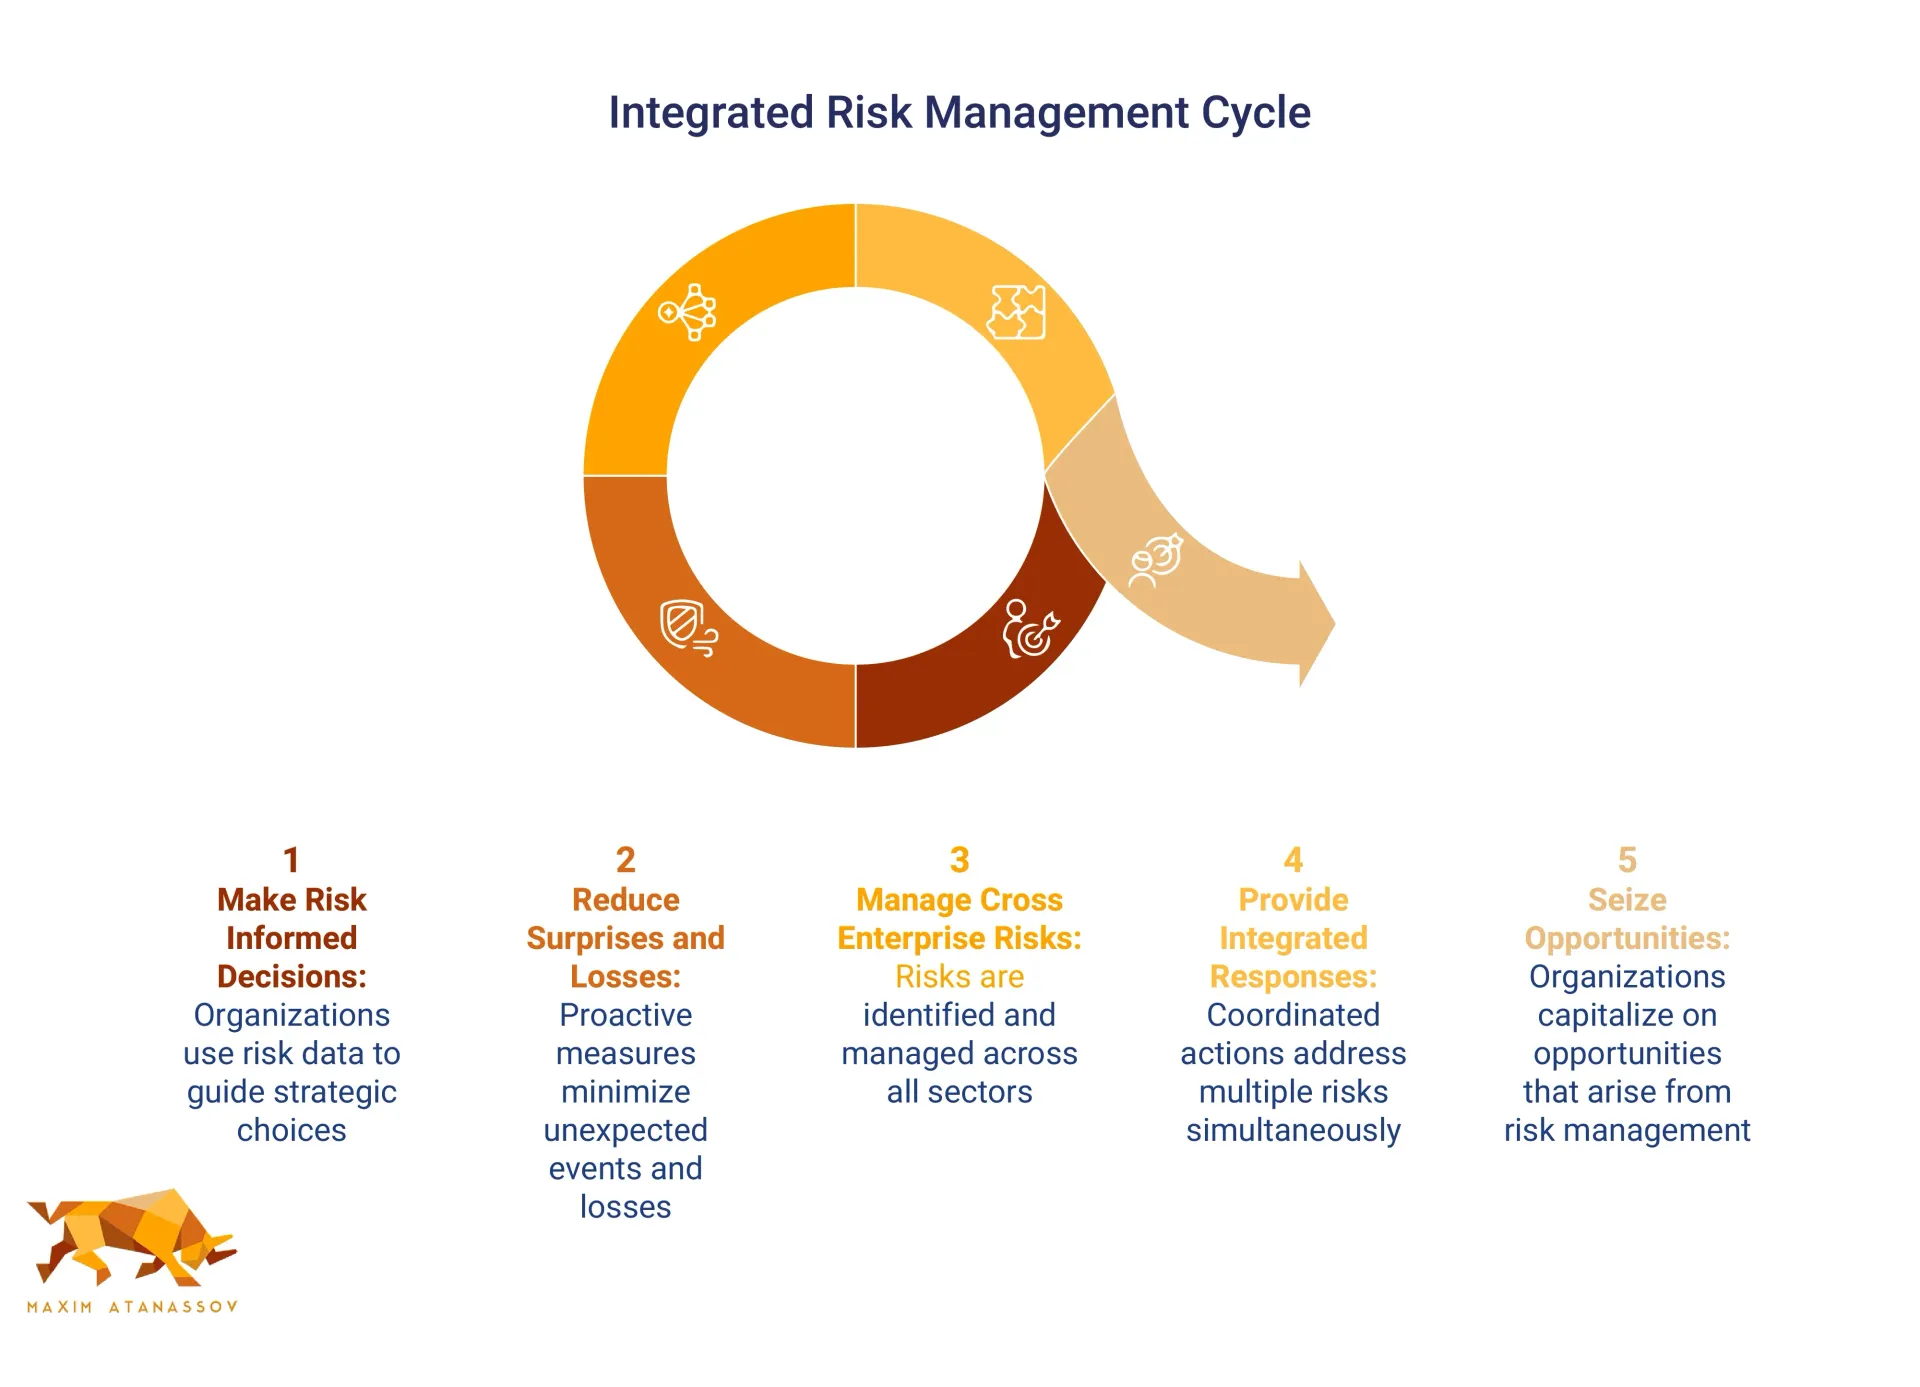
The most effective ERM programs don’t just help organizations avoid bad outcomes—they actively enable good things to happen by improving decision-making in the face of uncertainty.
Benefits of implementing an ERM system
Organizations implementing robust ERM systems realize significant benefits that extend far beyond regulatory compliance. These advantages directly impact both operational efficiency and strategic positioning.
- Reduced Operational Costs: ERM optimizes resource allocation, minimizes process inefficiencies, and prevents costly disruptions. By identifying potential drawbacks that could lead to errors and delays, organizations can allocate resources efficiently to areas vulnerable to high-end risks.
- Improved Decision-Making: ERM provides clear visibility into potential risks associated with various operational decisions and opportunities. Through stress testing and scenario planning, decision-makers can explore the possible outcomes of various strategies before implementation, increasing their confidence and effectiveness.
- Enhanced Brand Reputation: By proactively identifying and addressing risks before they escalate into major incidents, ERM helps maintain operational continuity. This approach instills trust and confidence in consumers and investors, demonstrating that the organization prioritizes safeguarding stakeholder interests.
- Improved Regulatory Compliance: ERM identifies potential compliance risks in advance, allowing organizations to take preemptive measures. This reduces the likelihood of regulatory investigations, fines, and penalties that can damage both finances and reputation.
- Competitive Advantage: Organizations with mature ERM capabilities gain strategic advantage through improved risk intelligence, allowing them to take calculated risks that competitors might avoid completely.
Overview of the ERM process
The ERM process follows a systematic approach that creates a continuous cycle of improvement. While frameworks may vary slightly, most follow these key steps:
- Establishing Context and Objectives: Define the scope, risk criteria, and strategic objectives that will frame the risk management activities.
- Risk Identification: Create a comprehensive inventory of risks that could affect the achievement of objectives. This involves methodically documenting potential threats and opportunities across all business units and functions.
- Risk Analysis and Assessment: Determine the likelihood and potential impact of identified risks, often using risk matrices and heat maps to visualize and prioritize them.
- Risk Evaluation and Prioritization: Compare risk levels against established criteria to determine which risks need immediate attention and which can be monitored.
- Risk Treatment/Mitigation: Select and implement strategies to address prioritized risks, which might include avoiding, accepting, reducing, or transferring the risk.
- Monitoring and Review: Continuously track risks and the effectiveness of mitigation strategies, making adjustments as the risk landscape evolves.
- Communication and Consultation: Share risk information with stakeholders throughout the process to ensure alignment and buy-in.
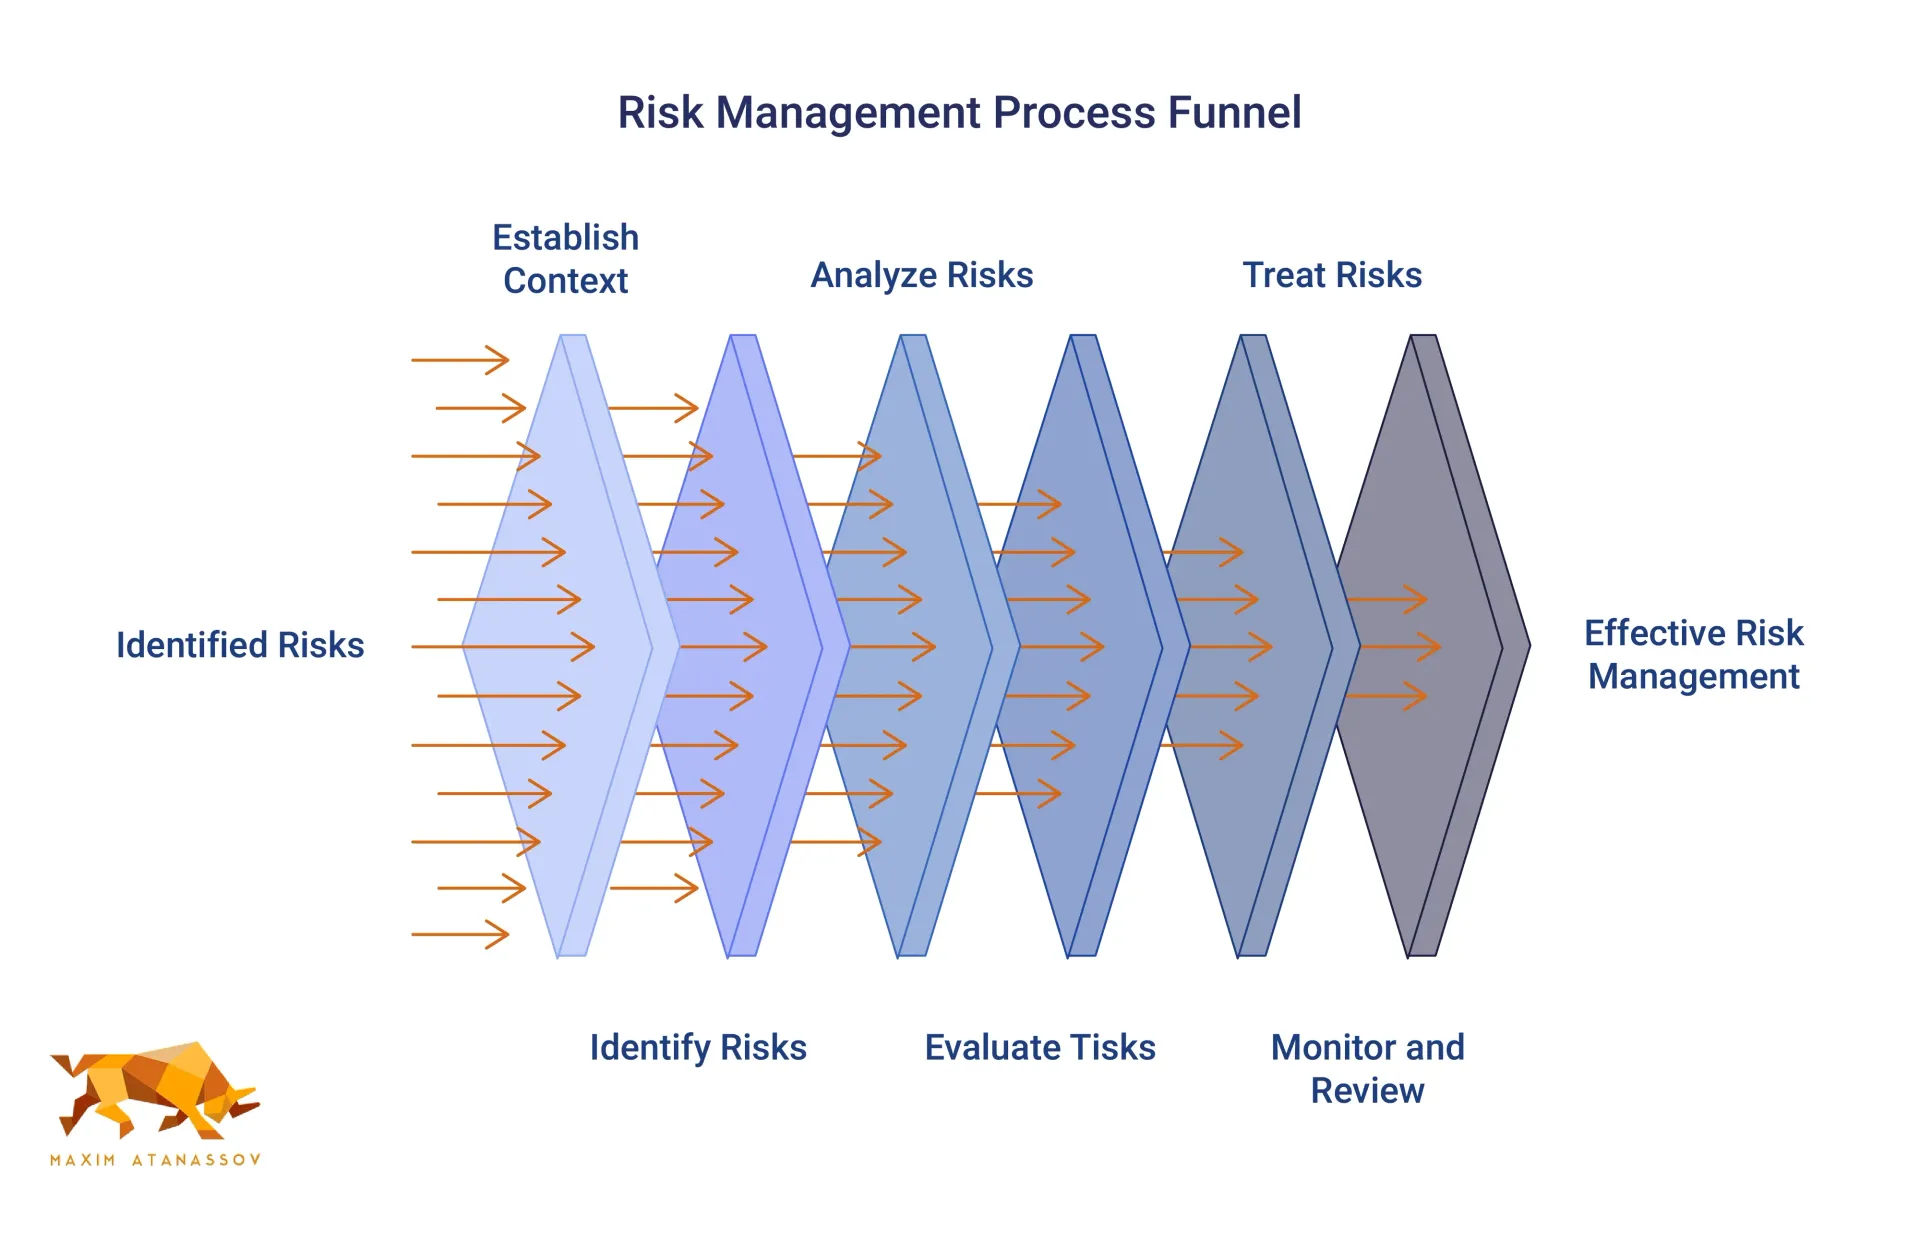
Effective ERM isn't a one-time exercise but rather a continuous cycle that becomes embedded in an organization's strategic and operational processes.
Key Components of a Risk Management Dashboard
A risk management dashboard transforms abstract risk concepts into visual, actionable intelligence. It’s where the rubber meets the road—translating complex risk data into clear signals that drive decision-making. Risk Management Dashboards display high-level KPIs and insights to communicate risk programs’ overall health, ensuring that stakeholders can quickly grasp the status and effectiveness of risk initiatives.
Risk committees play a crucial role in using these dashboards for effective strategic decision-making. They enable risk committees, along with Chief Risk Officers and Board Members, to monitor metrics, assess enterprise risk management, and facilitate proactive risk strategies to enhance corporate governance and resource allocation.
Key Risk Indicators (KRIs) and their role in ERM
Key Risk Indicators (KRIs) are the vital signs of your organization's risk health—metrics that provide early warning signals of increasing risk exposure across various business areas. Unlike lagging indicators that tell you what has already happened, effective KRIs are forward-looking metrics that alert you to potential problems before they materialize.
KRIs typically fall into several categories:
- Quantitative KRIs: Monitor data from algorithms and system outputs to identify outliers and areas for improvement.
- Qualitative KRIs: Analyze probability and suggest outcomes that may improve future scenarios.
- Financial KRIs: Focus on money-related areas, including acquisitions, budgetary measures, and economic changes.
- Operational KRIs: Evaluate risks from workflow changes, leadership transitions, or process inefficiencies.
- Technological KRIs: Focus on security measures protecting your business and customers, including site logins, firewall access, security breaches, and account management.
- Human Resources KRIs: Monitor employee-related metrics like staff turnover, recruitment efficiency, and satisfaction levels.
Essential KRIs that should be included in any risk management dashboard include:
- Risk Exposure Levels: These provide a snapshot of the organization's current risk landscape, helping identify the severity and probability of risks affecting various business areas.
- Incident Response Times: Measuring how quickly your team addresses and neutralizes threats reflects operational readiness and helps identify bottlenecks in response processes.
- Compliance Adherence Rates: These metrics show how well your organization conforms to regulations and internal policies, highlighting areas at risk of non-compliance.
- Risk Mitigation Effectiveness: This evaluates how successfully your strategies reduce or eliminate risks, helping refine approaches to align with evolving risk profiles.
- Financial Impact of Risks: Measuring actual or potential financial losses helps assess economic impact and prioritize mitigation efforts.
Effective KRIs aren't static—they evolve as your business and the risk landscape change. The process for developing KRIs typically involves working with subject matter experts to identify metrics, setting appropriate thresholds, and determining the relative weight or importance of each indicator.
Integration with other business systems and data sources
A powerful risk management dashboard doesn't exist in isolation—it thrives on connections to diverse data sources throughout your enterprise. Integration capabilities determine how comprehensive your risk visibility will be.
Successful integration encompasses:
- Financial Systems: Incorporating financial data provides insights into liquidity risks, credit exposures, and financial performance trends.
- Operational Systems: Connecting to ERP, CRM, and supply chain systems enables the monitoring of process-related risks and operational inefficiencies.
- Compliance and Regulatory Systems: Integration with compliance tracking tools ensures regulatory risks are captured and monitored effectively.
- External Data Sources: Market data, economic indicators, and industry benchmarks provide context for internal risk assessments.
- Security and IT Systems: Cybersecurity tools, network monitoring, and incident management systems feed critical technology risk data.
As noted in one MetricStream case study, effective integration enabled a Fortune 500 company to replace "time-consuming and labor-intensive" manual processes with automated reporting that consolidated investigative risk information. This integration provided "the ability to track risk profiles, control ownership, assessment plans, and remediation status on graphical charts." Additionally, compliance attestations can be created and scheduled for completion based on internal or external policies in Protecht.
ERM, further streamlining risk management processes. Organizations can also rapidly deploy and collaborate anywhere on risk and control assessments using Protecht. ERM, enhancing flexibility and efficiency.
Customization options for different user roles and needs
Risk information needs vary dramatically across an organization. Board members require strategic risk overviews, while operational managers need detailed, function-specific risk data. Effective dashboards accommodate these diverse needs through customization.
Essential customization features include:
- Role-Based Views: Tailored displays that show relevant risks based on user responsibilities and authority levels.
- Drill-Down Capabilities: The ability to move from high-level summaries to granular risk details with a few clicks.
- Personalized Alerts: Customizable notifications when specific risks exceed thresholds relevant to each user.
- Configurable Reports: Options to generate ad-hoc or scheduled reports based on user-defined parameters.
- Adjustable Time Horizons: Flexibility to view risks over different timeframes (daily, weekly, monthly, quarterly).
This level of customization ensures that each stakeholder receives precisely the risk information they need.
Designing a Risk Management Dashboard
Dashboard design isn't just about aesthetics—it's about creating an interface that communicates complex risk information clearly and drives appropriate action. Poor design leads to confusion, missed signals, and ultimately, ineffective risk management.
Best practices for creating a user-friendly dashboard
Creating an effective risk management dashboard requires balancing comprehensive risk coverage with usability. Following these design principles will ensure your dashboard delivers maximum value:
- Establish a Clear Visual Hierarchy: Organize information logically by placing critical data where users naturally look first—typically the top or left-hand side. Group related data points together and use white space to separate sections, making it easier for users to scan and locate key insights.
- Maintain Consistency: Use the same color scheme, font styles, and chart types across different dashboard views. Ensure that interactions like filtering, drilling down, or switching between views behave consistently throughout the interface.
- Minimize Cognitive Load: Reduce visual elements by eliminating duplicate or redundant information. Highlight the most important insights and use interactive elements like tooltips to provide additional context on demand rather than overwhelming users with too much information upfront.
- Design with Clarity and Usability: Simplicity is key when designing a dashboard. Avoid clutter by focusing on the most critical information and presenting it in an easy-to-understand format. Use visual elements such as charts, graphs, and heatmaps to make data interpretation intuitive.
- Ensure Interactivity and Flexibility: Incorporate interactive elements that allow users to drill down into data for more detailed insights. Customization options based on specific user needs greatly improve the dashboard's utility.
- Prioritize Security and Privacy: Implement robust security measures to protect data integrity and user privacy. Control access carefully so users only see information relevant to their roles.
A well-designed dashboard should tell a story at a glance while allowing users to explore the details behind that story when needed.
Data visualization techniques for effective risk communication
The way you visualize risk data significantly impacts how quickly and accurately users can interpret it. Different visualization techniques serve different purposes:
- Risk Heat Maps and Matrices: These plot risks based on likelihood and impact using color coding (typically red, yellow, green) to indicate severity. They provide an immediate visual cue about which risks require attention.
- Trend Lines and Time Series Charts: These show how key risk indicators have evolved over time, helping identify patterns and potential future developments.
- Bubble Charts: These can display three dimensions simultaneously (typically likelihood, impact, and a third variable like risk velocity or control effectiveness) for more nuanced risk comparisons.
- Tree Maps: These visualize hierarchical data through nested rectangles, which are useful for showing risk distribution across categories and subcategories.
- Radar Charts: These compare multiple risk dimensions simultaneously across different risk categories, providing a holistic view of complex risk profiles.
- Gauge Charts: These display current risk levels against predefined thresholds, similar to a speedometer, making it easy to see when risks approach critical levels.
According to UXPin, "Use appropriate visualizations, such as bar charts for comparisons and line charts for trends, to present data effectively." The right visualization makes complex risk relationships immediately apparent, enabling faster and better decision-making.
Using consequence vs. likelihood to prioritize risks
The consequence vs. likelihood matrix (also called a risk matrix or heat map) is the cornerstone of risk prioritization. It provides a systematic approach to determining which risks deserve immediate attention and which can be monitored less intensively.
A typical risk matrix uses a 5×5 grid with likelihood on one axis and impact (consequence) on the other. The matrix helps visualize and prioritize risks based on both dimensions:
Likelihood Scale (typically 1-5):
- Very Unlikely (Slim chance of occurrence)
- Not Likely (Low chances of occurrence)
- Possible (Fifty-fifty chances)
- Probable (Good chances of occurrence)
- Very Likely (Almost certain to occur)
Impact Scale (typically 1-5):
- Very Minor (Minimal effects)
- Minor (Limited, short-term effects)
- Moderate (Considerable effects)
- Major (Substantial effects)
- Catastrophic (Devastating, long-term effects)
The risk rating is calculated by multiplying likelihood by impact: Likelihood × Impact = Risk Rating.
For example, a risk with likelihood 4 (Probable) and impact 5 (Catastrophic) would have a risk rating of 20, indicating a high-priority risk requiring immediate attention.
When using this approach, remember that "the selected likelihood score relates to the likelihood of a particular consequence level actually occurring, NOT just the likelihood of the activity/event/management occurring." This crucial distinction ensures you're assessing true risk rather than just the probability of an event happening.
Risk Assessments and Management
Risk assessment is the foundation of effective ERM. Without a structured approach to identifying and analyzing risks, even the most sophisticated dashboard will fail to deliver value.
Importance of risk assessments in ERM
Risk assessments serve as the radar system of your organization—scanning the horizon for potential threats and opportunities that could affect your strategic objectives. They provide the raw material that feeds your risk management dashboard.
The risk assessment process is valuable because it:
- Creates a Comprehensive Risk Inventory: Risk assessments systematically identify both internal and external risks across all business areas, ensuring no significant threats are overlooked.
- Establishes a Common Risk Language: By defining risk categories, assessment criteria, and rating scales, risk assessments create a standardized approach to discussing and comparing diverse risks.
- Provides Data-Driven Prioritization: Objective assessment methodologies help organizations allocate limited resources to the most critical risks rather than the most recently occurred or most visible ones.
- Uncovers Root Causes and Relationships: Effective risk assessments dig beneath symptoms to identify underlying causes and interconnections between risks.
- Builds Institutional Knowledge: The assessment process captures and documents risk information that might otherwise remain siloed in individual departments or the minds of key employees.
The assessment process is often iterative, with each cycle refining the organization's understanding of its risk landscape and improving its ability to identify emerging risks.
How to create a risk heat map
A risk heat map transforms abstract risk assessments into a visual format that immediately communicates which risks deserve attention. Creating an effective heat map involves several key steps:
- Step 1: Identify Risks: Begin by listing potential risks that could impact your business across categories like financial, operational, strategic, compliance, and external risks.
- Step 2: Determine Risk Likelihood: Assess the probability of each risk occurring using a consistent scale. On a 5×5 matrix, likelihood is typically rated from 1 (Very Unlikely) to 5 (Very Likely).
- Step 3: Assess Impact Severity: Evaluate the potential consequences if each risk materializes, again using a consistent scale from 1 (Minimal impact) to 5 (Severe impact).
- Step 4: Calculate Risk Rating: Multiply likelihood by impact to determine each risk's overall rating. For example: Likelihood (4) × Impact (5) = Risk Rating (20). Multiplication, rather than addition, provides a much better stratification of the risk rating, allowing you to adopt a more precise risk response.
- Step 5: Plot on the Matrix: Create a grid with likelihood on one axis and impact on the other. Place each risk on the matrix based on its scores.
- Step 6: Analyze and Prioritize: Risks in the top-right quadrant (high likelihood, high impact) require immediate attention, while those in the bottom-left (low likelihood, low impact) are lower priorities.
- Step 7: Review Regularly: Risk environments are dynamic. Update your heat map regularly based on new data or changes in the business environment.
Color-coding the matrix (typically red for high risks, yellow for medium risks, and green for low risks) enhances its visual impact and makes priorities immediately apparent.
When creating a risk heat map, remember that "it is vital to ensure that when choosing the combination of consequence and likelihood that the selected likelihood score relates to the likelihood of a particular consequence level actually occurring, NOT just the likelihood of the activity/event/management occurring"
Using Risk Assessments to Inform Risk Management Decisions
Risk assessments aren’t just compliance exercises—they drive concrete actions and inform strategic decisions throughout the organization. Effective risk assessments inform:
- Resource Allocation: Directing limited risk management resources toward the highest-priority risks identified in the assessment.
- Control Design: Developing controls specifically tailored to address the unique characteristics and root causes of prioritized risks.
- Risk Appetite Decisions: Calibrating the organization’s risk ap
- petite based on a thorough understanding of the risk landscape.
- Strategic Planning: Incorporating risk insights into strategic planning to avoid initiatives with unacceptable risk profiles or to strengthen plans against identified vulnerabilities.
- Performance Metrics: Developing key risk indicators (KRIs) based on risks identified as most significant to organizational objectives.
- Insurance and Risk Transfer: Making informed decisions about which risks to transfer through insurance or other mechanisms.
Risk mitigation strategies play a crucial role in enhancing organizational resilience by refining these processes through granular insights gained from comparing specific assessments.
The most mature organizations integrate risk assessments directly into their decision-making processes, ensuring that risk considerations become part of everyday business operations rather than a separate activity.
Implementing a Risk Management Dashboard
Implementation determines whether your risk management dashboard becomes a valuable strategic tool or an unused corporate artifact. Successful implementation requires careful planning and a focus on both technical and human factors.
Software features to look for in a risk management dashboard
The right dashboard solution can transform risk management from a periodic exercise into a continuous, value-adding process. When evaluating options, prioritize these essential features:
- Comprehensive Risk Data Management: The system should capture, store, and process diverse risk data from multiple sources, creating a single source of truth for risk information.
- Customizable Visualizations: Look for flexible visualization options that can be tailored to different risk types and user preferences—from heat maps and trend charts to gauges and tree maps.
- Interactive Drill-Down Capabilities: Users should be able to start with a high-level view and progressively explore deeper layers of detail to understand root causes and relationships.
- Integration Capabilities: The system must integrate seamlessly with existing business systems and data sources to provide a comprehensive risk view without manual data entry.
- Automated Alerts and Notifications: The dashboard should generate alerts when risk thresholds are breached, enabling timely intervention before risks escalate.
- Role-Based Access Control: Security features should ensure users only see information relevant to their responsibilities, protecting sensitive risk data.
- Scenario Modeling: The ability to model "what-if" scenarios helps organizations anticipate potential outcomes and plan mitigation strategies.
- Audit Trail and Version Control: The system should maintain a detailed history of risk assessments, decisions, and actions for accountability and regulatory compliance.
- Mobile Accessibility: With decision-makers often on the move, mobile access to key risk information is crucial for timely responses.
- Customizable Reporting: The ability to generate ad-hoc reports and schedule regular risk updates tailored to different stakeholder needs is essential.
- AI and Machine Learning Capabilities: Advanced systems leverage AI to identify patterns, predict emerging risks, and suggest mitigation strategies.
According to Gartner, "By 2025, 50% of global midmarket and large enterprises will depend on risk management solutions to aggregate digital risks in their business's ecosystem." Choosing a solution with the right features is crucial for future-proofing your risk management capabilities.
Change management and user adoption strategies
Even the most sophisticated dashboard is useless if people don't use it. Successful implementation requires a thoughtful change management approach:
- Executive Sponsorship: Secure visible support from top leadership to signal the importance of the new risk management approach.
- Stakeholder Mapping: Identify all groups affected by the new system and tailor communication and training to their specific needs and concerns.
- Phased Rollout: Consider a staged implementation, starting with a pilot group to refine the system before full deployment.
- Comprehensive Training: Offer a mix of training formats (e.g., hands-on workshops, video tutorials, quick reference guides) to accommodate different learning styles.
- Feedback Loops: Establish mechanisms for users to provide input on the dashboard and visibly act on this feedback to encourage engagement.
- Success Stories: Share early wins and tangible benefits to build momentum and enthusiasm for the new system.
- Metrics and Incentives: Develop KPIs for dashboard usage and potentially tie them to performance evaluations to drive adoption.
- Continuous Improvement: Treat the implementation as an ongoing process, regularly soliciting user feedback and updating the system to meet evolving needs.
As noted in the Journal of Risk Research, "The success of ERM implementation depends on how well it is integrated into the organization's culture." Change management isn't just about technology adoption—it's about shifting organizational mindsets to embrace a more proactive, data-driven approach to risk.
Benefits of a Risk Management Dashboard
A well-implemented risk management dashboard delivers tangible benefits that extend far beyond regulatory compliance, transforming how organizations understand and manage uncertainty.
Improved risk visibility and awareness
Risk management dashboards serve as the central nervous system for organizational risk, dramatically enhancing visibility across the enterprise:
- Real-Time Risk Monitoring: Dashboards provide up-to-the-minute views of key risk indicators, allowing organizations to spot emerging threats before they escalate.
- Holistic Risk View: By aggregating data from multiple sources, dashboards offer a comprehensive picture of risks across different business units and functions.
- Early Warning Signals: Well-designed dashboards highlight subtle changes in risk patterns, serving as an early warning system for potential issues.
- Improved Risk Communication: Visual representations make complex risk data accessible to a broader audience, fostering a shared understanding of the organization's risk profile.
According to McKinsey, organizations with advanced risk management capabilities are "23% more likely than others to say they are better than competitors at both reducing risk events and seizing risk opportunities."
Enhanced decision-making and strategic planning
Risk management dashboards don't just highlight problems—they empower better decision-making at all levels:
- Data-Driven Decisions: By providing objective risk data, dashboards reduce reliance on gut feelings or outdated assumptions in decision-making.
- Scenario Planning: Advanced dashboards allow leaders to model different scenarios and understand potential outcomes before committing to a course of action.
- Resource Optimization: Clear risk prioritization helps organizations allocate limited resources to areas with the highest potential impact.
- Opportunity Identification: Effective risk management isn't just about avoiding negatives—it also helps identify positive risks (opportunities) that competitors might miss.
- Strategic Alignment: By linking risks directly to strategic objectives, dashboards ensure that risk considerations are integrated into high-level planning.
Increased efficiency and productivity
Beyond improving decision quality, risk management dashboards drive operational efficiencies:
- Automated Reporting: Dashboards eliminate time-consuming manual report generation, freeing up risk professionals to focus on analysis and mitigation.
- Streamlined Processes: Centralized risk data reduces the duplication of effort across departments and speeds up risk-related workflows.
- Faster Response Times: Real-time alerts and clear prioritization enable quicker responses to emerging risks, potentially averting crises.
- Improved Collaboration: Shared dashboards facilitate cross-functional cooperation on risk management, breaking down silos.
- Resource Optimization: Clear visibility into risk levels helps organizations avoid over-investing in low-priority risks while ensuring adequate coverage for critical threats.
A study by Aon found that organizations with mature risk management practices experienced 18% less stock price volatility. This stability isn't just about avoiding downside—it's about creating a more efficient, resilient organization capable of seizing opportunities in uncertain environments.
Case Studies and Success Stories
Real-world examples illustrate the transformative power of well-implemented risk management dashboards across various industries.
Financial Services: Global Bank Risk Transformation
A leading global bank implemented an enterprise-wide risk management dashboard as part of a broader risk transformation initiative. Key outcomes included:
- 30% reduction in time spent on risk reporting and data gathering
- Identification of $50 million in potential cost savings through improved risk-based decision making
- 40% increase in early detection of emerging risks
- Improved regulatory relationships due to enhanced risk transparency
The bank's Chief Risk Officer noted, "Our new risk dashboard has moved us from reactive firefighting to proactive risk management. We're not just avoiding problems—we're identifying opportunities faster than our competitors."
Manufacturing: Automotive Supply Chain Risk Mitigation
A major automotive manufacturer implemented a risk management dashboard focused on supply chain vulnerabilities. Results included:
- 25% reduction in supply chain disruptions
- $30 million in avoided costs from early identification of potential supplier bankruptcies
- 15% improvement in on-time delivery performance
- Enhanced ability to model the impact of geopolitical events on global supply networks
The VP of Supply Chain commented, "Our dashboard gives us x-ray vision into our entire supply network. We can now spot potential issues months in advance and take corrective action before they impact production."
Healthcare: Hospital Network Patient Safety Initiative
A large hospital network deployed a risk management dashboard focused on patient safety and clinical risk. Outcomes included:
- 20% reduction in preventable adverse events
- $40 million decrease in malpractice claims over 3 years
- 35% improvement in the early detection of potential safety issues
- Measurable increase in staff engagement with risk management processes
The Chief Medical Officer stated, "Our dashboard has created a culture of safety awareness. Every staff member now has the tools to identify and escalate potential risks before they harm patients."
Technology: Software Company Cybersecurity Enhancement
A rapidly growing software company implemented a risk management dashboard with a focus on cybersecurity and data protection risks. Results included: * 50% reduction in time to detect and respond to potential security breaches * 30% decrease in successful phishing attacks through improved risk awareness * $5 million in avoided costs from prevented data breaches * Competitive advantage in enterprise sales due to demonstrable risk management capabilities Keeper's Risk Management Dashboard provides comprehensive security posture information covering end-user deployment and event monitoring, ensuring organizations can maintain robust defenses against evolving threats.
- 50% reduction in time to detect and respond to potential security breaches
- 30% decrease in successful phishing attacks through improved risk awareness
- $5 million in avoided costs from prevented data breaches
- Competitive advantage in enterprise sales due to demonstrable risk management capabilities
The Chief Information Security Officer noted, "Our dashboard doesn't just help us avoid breaches—it's become a key differentiator in our sales process. Customers trust us because they can see how seriously we take risk management."
These case studies demonstrate that effective risk management dashboards deliver quantifiable benefits across diverse industries and risk types. The common thread is a shift from reactive to proactive risk management, enabling organizations to navigate uncertainty with greater confidence and agility.
Overcoming Common Challenges
Implementing a risk management dashboard isn't without obstacles. Recognizing and addressing common challenges is crucial for success.
Data Quality and Integration Issues
Challenge: Many organizations struggle with siloed, inconsistent data across different systems, making it difficult to create a unified view of risk.
Solution:
- Implement data governance processes to ensure consistency across sources
- Invest in data integration tools to automate the consolidation of risk data
- Start with a "minimum viable dashboard" using available high-quality data, then expand incrementally
Resistance to Change
Challenge: Employees may resist new risk management processes, viewing them as additional bureaucracy or a threat to established ways of working.
Solution:
- Clearly communicate the benefits of the new system, emphasizing how it will make everyone's job easier.
- Involve end-users in the design process to ensure the dashboard meets their needs.
- Provide comprehensive training and ongoing support.
- Celebrate early wins to build momentum.
Overcomplication
Challenge: In an attempt to be comprehensive, organizations sometimes create overly complex dashboards that overwhelm users with information.
Solution:
- Focus on key risk indicators that directly tie to strategic objectives.
- Use intuitive visualizations that communicate insights at a glance.
- Implement role-based views to show users only the information relevant to their responsibilities.
- Provide drill-down capabilities for those who need deeper analysis.
Lack of Leadership Buy-In
Challenge: Without strong executive support, risk management initiatives can be underfunded and underutilized.
Solution:
- Develop a clear business case linking the dashboard to strategic objectives and potential cost savings.
- Engage executives early in the process, incorporating their input into the dashboard design.
- Provide regular updates on dashboard impact, tying results to key business metrics.
- Consider tying risk management performance to executive compensation.
Keeping the Dashboard Current
Challenge: Risk environments change rapidly, and dashboards can quickly become outdated if not regularly maintained.
Solution:
- Implement automated data feeds to ensure real-time updates where possible
- Establish a regular review process to reassess risk priorities and metrics
- Create clear ownership and accountability for different aspects of the dashboard
- Leverage AI and machine learning to help identify emerging risks and trends
By proactively addressing these challenges, organizations can significantly increase the likelihood of successful implementation and long-term value creation from their risk management dashboards.
Future Directions in Risk Management
The risk management landscape is evolving rapidly, driven by technological advancements and changing business environments. Forward-thinking organizations are already exploring these emerging trends:
Artificial Intelligence and Machine Learning
AI and ML are revolutionizing risk management, enabling:
- Predictive Risk Analytics: Advanced algorithms can identify subtle patterns and predict potential risks before they materialize.
- Natural Language Processing: AI can analyze vast amounts of unstructured data (news, social media, internal communications) to identify emerging risks.
- Automated Risk Assessment: Machine learning models can continuously update risk assessments based on real-time data, reducing reliance on periodic manual reviews.
- Intelligent Scenario Modeling: AI-powered systems can generate and analyze complex risk scenarios, helping organizations prepare for a wider range of potential futures.
According to Deloitte, "By 2025, it is expected that AI will be used by 95% of Fortune 500 companies in their risk management operations."
Integration of External Data Sources
Future risk management dashboards will increasingly incorporate external data to provide broader context:
- Real-Time Market Data: Integrating financial market feeds, commodity prices, and economic indicators for more dynamic risk assessments.
- Social Media Sentiment Analysis: Monitoring public perception and potential reputational risks in real time.
- Geopolitical Risk Indicators: Incorporating data on political stability, regulatory changes, and international relations to assess country and regional risks.
- Climate and Environmental Data: Integrating climate models and environmental monitoring to assess physical and transition risks related to climate change.
Quantum Computing
While still in early stages, quantum computing holds immense potential for risk management:
- Complex Risk Modeling: Quantum algorithms could enable real-time analysis of highly complex, interconnected risks that are computationally infeasible with classical computers.
- Optimization Problems: Quantum computing could revolutionize portfolio optimization and risk-adjusted resource allocation.
- Cryptography and Security: Quantum technologies will both create new cybersecurity risks and offer new solutions for secure communication.
Augmented and Virtual Reality
AR and VR technologies could transform how organizations visualize and interact with risk data:
- Immersive Risk Scenarios: VR could allow decision-makers to "walk through" complex risk scenarios, improving understanding and decision-making.
- 3D Risk Mapping: AR could overlay risk information onto physical assets or processes, providing context-aware risk insights.
- Virtual War Rooms: VR meeting spaces could enable global risk management teams to collaborate as if they were in the same room, enhancing crisis response capabilities.
Blockchain and Distributed Ledger Technology
Blockchain has the potential to enhance several aspects of risk management:
- Immutable Audit Trails: Creating tamper-proof records of risk assessments, decisions, and actions.
- Smart Contracts: Automating risk transfer and insurance processes, potentially creating new models for dynamic risk sharing.
- Supply Chain Transparency: Enhancing visibility into complex supply networks, reducing operational and reputational risks.
As these technologies mature, risk management dashboards will evolve from passive monitoring tools into active decision support systems that not only highlight risks but also suggest optimal responses and automatically execute certain risk mitigation actions.
Organizations that stay ahead of these trends and integrate emerging technologies into their risk management practices will be better positioned to navigate the increasingly complex and interconnected risk landscape of the future.
Conclusion
In an era defined by volatility, uncertainty, complexity, and ambiguity, effective risk management isn't just a defensive play—it's a strategic imperative that can drive competitive advantage. The risk management dashboard serves as the nerve center of this strategic capability, transforming abstract threats and opportunities into actionable intelligence.
Key Takeaways
- Holistic Risk View: Modern risk management dashboards provide a comprehensive, real-time view of an organization's risk landscape, breaking down silos and enabling truly enterprise-wide risk management.
- Data-Driven Decision Making: By presenting complex risk data in intuitive, visual formats, dashboards empower leaders at all levels to make more informed, confident decisions in the face of uncertainty.
- Proactive Risk Culture: Well-implemented dashboards shift organizational mindsets from reactive crisis management to proactive risk identification and mitigation.
- Efficiency and Agility: Automated data integration and reporting free up resources from manual processes, allowing risk professionals to focus on analysis and strategy.
- Continuous Evolution: The most effective risk management approaches treat dashboard implementation as an ongoing process of refinement and adaptation to changing business needs and technological capabilities.
The Path Forward
As you embark on your journey to implement or upgrade your risk management dashboard, consider these final thoughts:
- Start with Strategy: Align your dashboard design with your organization's strategic objectives. A clear link between risk management and business goals is crucial for sustained engagement and value creation.
- Embrace Technology, but Don't Forget the Human Element: While AI, machine learning, and advanced analytics offer powerful new capabilities, remember that risk management is ultimately about human judgment. Design your dashboard to augment and inform human decision-making, not replace it.
- Foster a Learning Culture: Use your dashboard not just to monitor risks but to learn from them. Encourage post-mortems on both averted risks and realized threats to improve your risk management capabilities continuously.
- Look Beyond Compliance: While regulatory compliance is important, the true value of advanced risk management lies in its ability to drive better business outcomes. Design your dashboard with an eye towards creating a competitive advantage, not just avoiding penalties.
- Prepare for the Future: As you design your dashboard, consider how emerging technologies like AI, blockchain, and quantum computing might reshape your risk landscape and risk management capabilities in the coming years.
In a world where the pace of change continues to accelerate, organizations that can effectively identify, assess, and respond to risks will be best positioned to thrive. A well-designed, strategically implemented risk management dashboard is more than just a tool—it's a key that unlocks this crucial organizational capability.
By following the principles and practices outlined in this guide, you'll be well on your way to transforming your organization's approach to risk, turning uncertainty from a threat into a source of strategic advantage.
Share

Maxim Atanassov, CPA-CA
Serial entrepreneur, tech founder, investor with a passion to support founders who are hell-bent on defining the future!
I love business. I love building companies. I co-founded my first company in my 3rd year of university. I have failed and I have succeeded. And it is that collection of lived experiences that helps me navigate the scale up journey.
I have found 6 companies to date that are scaling rapidly. I also run a Venture Studio, a Business Transformation Consultancy and a Family Office.